- Data-driven content optimization means using real performance metrics - not guesses - to decide what to publish, when, and how.
- The core metrics to track are reach, engagement rate, click-through rate, saves/shares, and conversion rate.
- A consistent audit cycle (weekly + monthly) outperforms sporadic one-off reviews every time.
- Platform algorithms reward content that earns early engagement - your first 30-60 minutes after posting matter more than any other window.
- Matching content format to your specific audience data reduces wasted effort and increases ROI faster than any other single change.
Data-driven content optimization is the practice of using measurable performance signals to improve what you create, how you distribute it, and when you publish it. Instead of relying on creative instinct alone, you let the numbers confirm or challenge your assumptions. Whether you manage one brand account or ten, building this habit turns content from a guessing game into a repeatable process.
What exactly is data-driven content optimization?
Data-driven content optimization is the structured process of collecting performance data from published content, drawing conclusions from that data, and applying those conclusions to future content decisions. The key word is "structured" - it is not enough to occasionally check how many likes a post got. You need a consistent framework that connects inputs (format, topic, timing, copy style) to outputs (reach, engagement, clicks, conversions).
Think of it this way: every piece of content you publish is a small experiment. The post either confirms a hypothesis or refutes it. Without tracking, those experiments produce no learning. With tracking, each post tells you something useful about your audience that the next post can act on.
This process applies to every channel - Instagram Reels, LinkedIn articles, TikTok videos, Pinterest pins, Facebook posts, and long-form blog content on WordPress. The specific metrics vary by platform, but the underlying logic stays the same.
The difference between vanity metrics and actionable metrics
Not all numbers are equally useful. Vanity metrics - total follower count, raw impression volume, total likes - look good in reports but rarely tell you what to change. Actionable metrics are directly connected to a decision you can make.
- Engagement rate (not total likes): shows how well content resonates relative to your audience size
- Save rate: particularly strong on Instagram and Pinterest - saves signal that people found the content worth returning to
- Click-through rate (CTR): measures whether your content is compelling enough to prompt action
- Shares and reposts: the strongest organic distribution signal on almost every platform
- Conversion rate from social: the ultimate business metric, tracking what percentage of social visitors complete a desired action
- Watch-through rate: for video content on TikTok, YouTube, and Reels - indicates whether the content holds attention
When you optimize for actionable metrics, your decisions get sharper and your content budget goes further.
Which metrics should you track for content optimization?
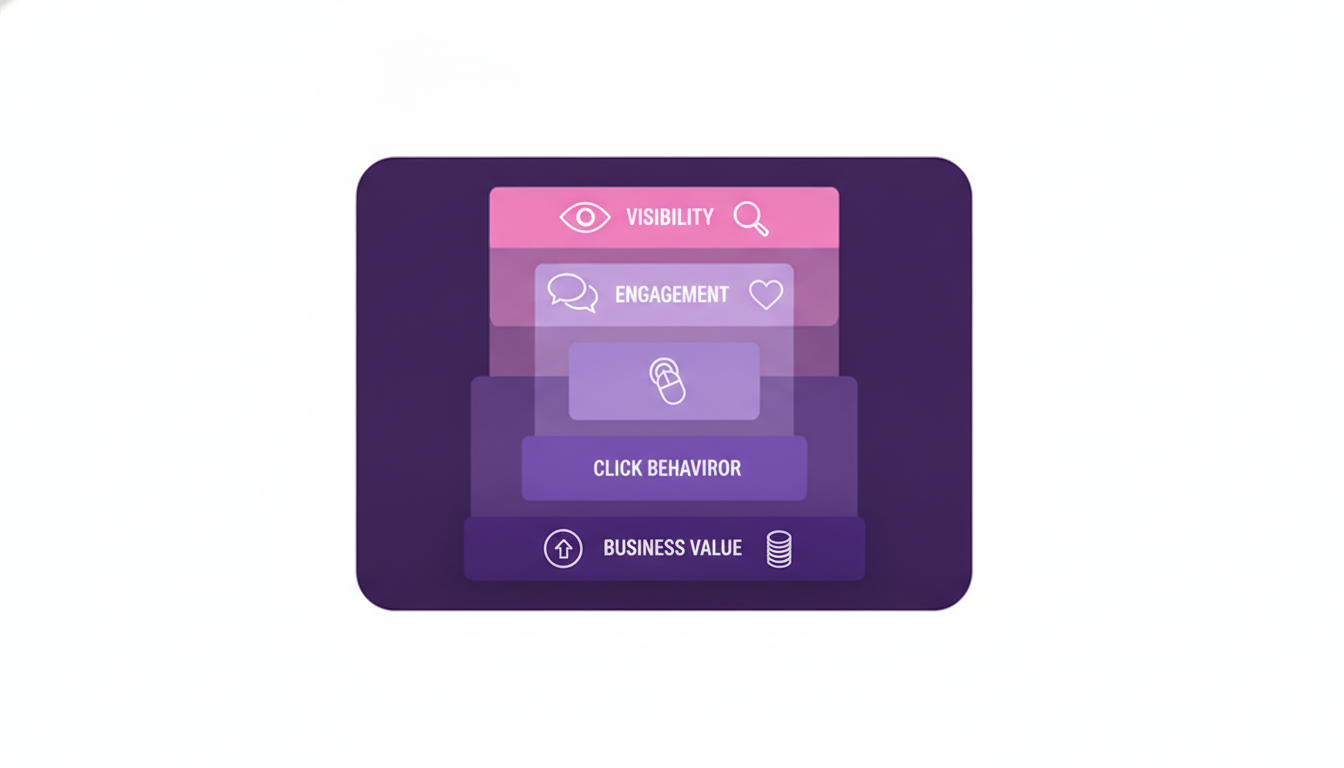
The metrics worth tracking depend on your goals, but a solid baseline covers six categories: reach, engagement, click behavior, video retention, audience growth rate, and off-platform conversions. Start with these six before adding anything more complex.
| Metric | Best Platform(s) | What It Tells You | Optimization Use |
|---|---|---|---|
| Engagement Rate | Instagram, LinkedIn, Facebook | Content resonance relative to audience size | Which topics and formats work best |
| Save Rate | Instagram, Pinterest | Perceived long-term value of content | Identify educational or reference-style posts to repeat |
| Watch-Through Rate | TikTok, YouTube, Reels | Whether your video holds attention | Hook and pacing improvements |
| Click-Through Rate | LinkedIn, Twitter/X, Facebook | Call-to-action effectiveness | Copy and CTA testing |
| Audience Growth Rate | All platforms | Net follower change as a percentage | Overall channel health and content strategy |
| Conversion Rate | All platforms (via UTM tracking) | Social-to-business ROI | Aligning content topics with business goals |
A useful benchmark to keep in mind: organic engagement rates above 1-3% on Instagram and LinkedIn are generally considered healthy for most brand accounts, though this varies significantly by industry and account size. Video content consistently outperforms static images on watch time and shares across every major platform, which is why most algorithm updates since 2023 have continued to favor it.
How do you build a content audit process that actually works?
A working content audit follows a fixed rhythm - weekly for tactical adjustments and monthly for strategic ones. Ad hoc reviews are better than nothing, but they rarely produce the pattern recognition that a regular cadence does.
Weekly audit: tactical layer
Each week, review the past 7 days of published content. The goal is to catch anything that dramatically over- or underperformed so you can respond quickly - either by amplifying a hit or learning from a miss before the next publishing cycle.
- Pull engagement rate, reach, and saves for every post published that week
- Flag the top 20% and bottom 20% performers
- Note the format, topic, posting time, and copy style for each flagged post
- Identify one pattern from the top performers and one from the bottom
- Apply one concrete change to next week's content plan based on those patterns
Monthly audit: strategic layer
Once a month, zoom out and look at aggregate trends across 4-5 weeks of data. This is where you spot shifts in what your audience responds to - format fatigue, topic burnout, or new content types gaining traction.
- Calculate average engagement rate per format (carousel, Reel, static, Story, video)
- Rank your top 10 posts by engagement and identify the topic clusters they belong to
- Compare audience growth rate month-over-month to detect acceleration or slowdown
- Review click-through rates by channel to see where your audience is most action-ready
- Update your content pillars and posting frequency based on what the data shows
What role does posting timing play in content optimization?
Timing is one of the most underused optimization levers. The same piece of content can perform significantly differently depending on when it goes live - because platform algorithms factor in early engagement velocity to determine how widely to distribute a post. A post that earns strong engagement within its first 30-60 minutes typically receives broader reach than an identical post that gets engagement slowly over several hours.
The right posting time is audience-specific, not universal. Generic "best time to post" guides are a starting point, not a final answer. Your followers have specific behavior patterns tied to their time zones, occupations, and platform habits. The only way to find your actual optimal windows is to test across your own audience data over at least 4-6 weeks.
Most native platform analytics tools - and dedicated scheduling tools - show you when your followers are most active broken down by day and hour. Use that data as your primary signal. You can also cross-reference it with engagement rate by time slot using tools like Brandlix's best-time-to-post analyzer, which surfaces your personal peak windows based on historical post performance rather than generic benchmarks.
Platform-specific timing considerations
- LinkedIn: Business-hours posting windows (Tuesday through Thursday mornings) consistently outperform weekend posts for B2B content - the audience is simply not in a professional mindset on Saturdays
- Instagram and TikTok: Evening windows (6-9 PM in the follower's local timezone) tend to perform well, but this shifts significantly for younger demographics who use these platforms during school or commute hours
- Twitter/X and Threads: These platforms favor real-time conversation, so posting around news cycles, trending topics, or industry events often outweighs any fixed time-slot optimization
- Pinterest: Content has a much longer tail than other platforms - pins can surface in search results weeks or months after publishing, so timing is less critical than keyword optimization
How do you use A/B testing to optimize content at scale?
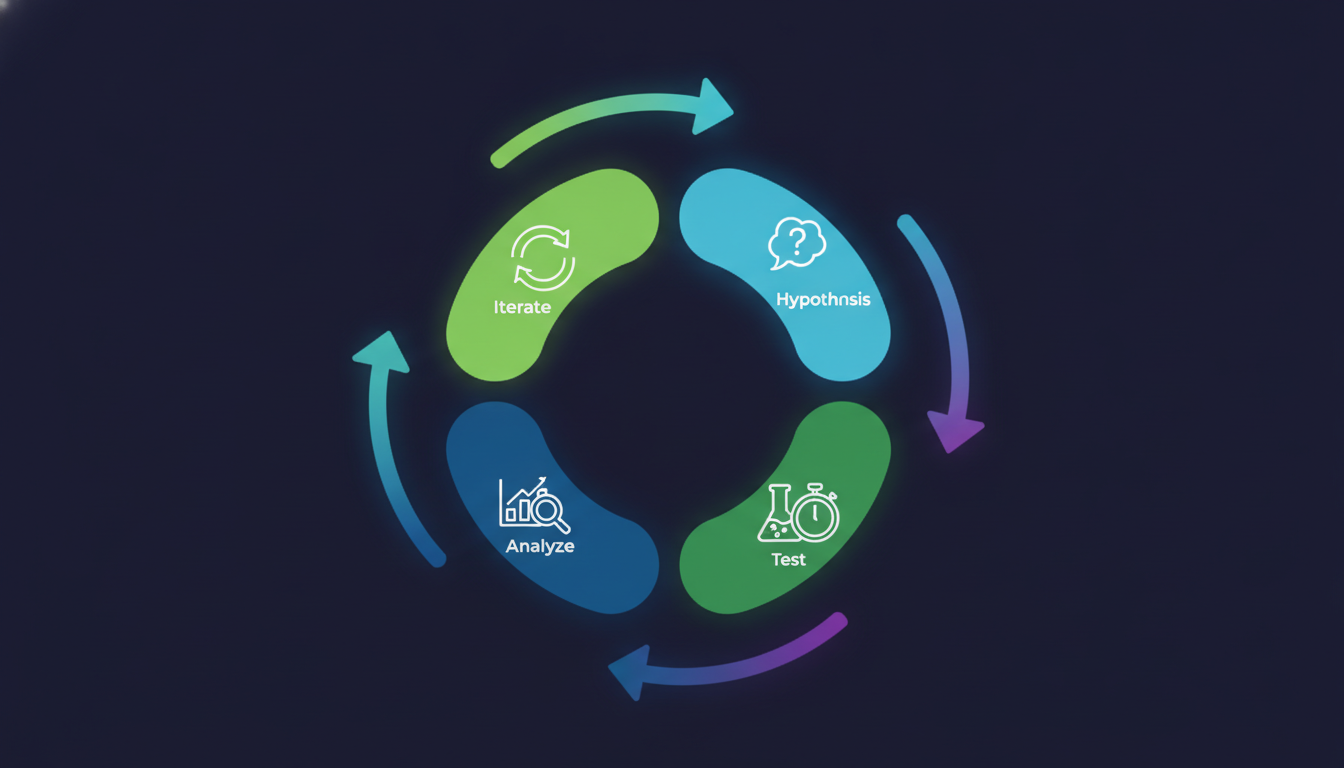
A/B testing for content optimization means publishing two variations of a post with one variable changed, then measuring which version performs better. Done consistently, it is the fastest way to build platform-specific knowledge about what your audience responds to.
The most important rule: change only one variable at a time. If you change the visual, the caption, and the posting time simultaneously, you cannot know which change caused the difference in performance.
Variables worth testing
- Hook (first line or first 3 seconds of video): This is the highest-leverage test because it directly affects whether someone stops scrolling at all
- Visual format: Carousel vs. single image vs. Reel vs. infographic - format affects not just engagement but the type of engagement (saves, shares, comments)
- Caption length: Short punchy captions vs. longer storytelling captions perform differently depending on platform and topic category
- Call to action: Subtle vs. direct CTAs, question-based CTAs vs. directive CTAs
- Hashtag strategy: Broad high-volume hashtags vs. niche specific ones - you can test this easily with a hashtag generator tool that shows estimated reach per tag
- Posting time: Run the same content type on Tuesday morning vs. Thursday evening to identify timing effects
Run each test for a minimum of 2-4 weeks before drawing conclusions. One post is not a data point - it is noise. A pattern across 8-12 posts in the same category is where real signal starts to emerge.
How do you turn content data into a repeatable publishing strategy?
Once you have 6-8 weeks of consistent audit data and a few A/B test results, you have enough raw material to build a repeatable publishing strategy. This is where data-driven optimization moves from a practice to a system.
The output of this step is a content framework - a documented set of decisions about format mix, topic weighting, posting frequency, and channel priority that is grounded in what your data shows rather than what feels right.
Building your content framework
- Define your format mix: Based on engagement rate by format, decide what percentage of your monthly posts should be video, carousel, static, and Stories. A reasonable starting split for Instagram might be 40% Reels, 35% carousels, 25% static - but adjust this to match your data, not this suggestion.
- Identify your top 3-5 content pillars: These are the topic categories your highest-performing content falls into. If tutorial-style posts and behind-the-scenes content consistently outperform promotional posts, your pillars should reflect that weighting.
- Set a sustainable frequency: Publishing frequency only helps if the content quality holds. The data often reveals a ceiling - posting 7 days a week may produce lower per-post engagement than posting 4-5 days a week. Find your quality-frequency balance.
- Assign platforms to goals: Your analytics will likely show that different platforms serve different purposes. LinkedIn may drive website clicks, Instagram may build brand awareness, and Pinterest may drive product discovery. Let this inform how you allocate effort across channels.
- Document and revisit quarterly: Write the framework down. Review it every 3 months with fresh data. Audiences shift, algorithms update, and what worked in Q1 may need recalibrating by Q3.
Tools like a structured content calendar make it much easier to execute a data-backed framework at scale, especially when you are managing content across multiple platforms simultaneously. Keeping all your planned posts visible in one place lets you spot imbalances in format or topic mix before you publish rather than after.
What tools do you need for data-driven content optimization?
You do not need a large tech stack to do this well. A lean, connected set of tools covering analytics, scheduling, and testing is sufficient for most teams and individual creators.
Native platform analytics
Every major platform - Instagram, LinkedIn, TikTok, Facebook, YouTube, Pinterest - provides free native analytics. These are your starting point. They are platform-specific but accurate, and they surface audience demographics, peak activity times, and post-level performance data you cannot get elsewhere without paying for third-party API access.
Cross-platform analytics tools
Native analytics become limiting when you manage multiple channels, because you are forced to jump between dashboards and manually reconcile data. A unified analytics view - like the one inside Brandlix's social media analytics dashboard - lets you compare performance across all 10 platforms in a single interface, which dramatically speeds up the audit process described earlier.
Scheduling and automation
Consistent publishing is a prerequisite for good data. If you post irregularly, it is hard to isolate variables like timing or format because your publishing cadence itself becomes a confounding factor. Using a social media autopilot to maintain a steady schedule frees up the mental bandwidth to focus on analysis rather than execution.
UTM tracking and web analytics
For any content that is meant to drive traffic to a website or landing page, UTM parameters are non-negotiable. They let you see exactly which platform, which post, and which campaign drove a conversion - without UTMs, your web analytics can only tell you that traffic came from "social media" in aggregate, which is almost useless for optimization decisions.
How do you avoid common mistakes in content data analysis?
The most common mistake is drawing conclusions from too little data. One post that doubles your normal engagement rate is interesting - but it is not a pattern. Two or three posts in the same format, covering similar topics, at similar times, that all outperform your baseline: that is a pattern worth acting on.
Other mistakes that undermine your optimization efforts
- Comparing absolute numbers across platforms: A 500-like post on Instagram and a 500-like post on LinkedIn represent completely different levels of performance because the user bases, algorithmic distribution, and content consumption habits are different
- Ignoring qualitative signals: Comments and DMs contain feedback that no metric captures directly. If multiple people ask the same question in your comments, that is a content brief for your next post
- Optimizing for the wrong stage: If your goal is brand awareness, optimizing purely for CTR will produce content that feels pushy. Match the metric to the goal at each stage of your funnel
- Not accounting for seasonal variation: Content performance shifts with seasons, holidays, news cycles, and industry events. A drop in engagement in August does not necessarily mean your content is getting worse
- Changing too many things at once: The more variables you change simultaneously, the less you learn. Discipline in testing one variable at a time feels slow but produces much more durable insights
Frequently Asked Questions
How long does it take to see results from data-driven content optimization?
Most teams start seeing meaningful patterns after 4-6 weeks of consistent tracking and auditing. However, the first actionable changes - adjusting posting times or testing a different content format - can produce visible differences within 2-3 weeks. The deeper strategic benefits, like a fully calibrated content framework, typically take 2-3 months to develop properly because you need enough data across different variables to draw reliable conclusions.
Do you need to be a data analyst to optimize content with data?
No. The core process - pulling weekly metrics, identifying your top and bottom performers, noting what they have in common, and applying one change per cycle - requires no statistical expertise. Native platform analytics present the data visually and in plain language. The discipline of doing it consistently matters far more than technical sophistication. Start with engagement rate and reach, master those two, then gradually add more metrics as your comfort grows.
How often should you update your content strategy based on analytics?
Make small tactical adjustments weekly based on recent post performance. Revisit your broader content strategy - pillars, format mix, channel priority, posting frequency - once per quarter. Quarterly reviews give you enough data to spot genuine trends rather than reacting to short-term noise. Completely overhauling your strategy based on a single bad week is one of the most common optimization mistakes brands make.
Which platform provides the best native analytics for content optimization?
LinkedIn and YouTube offer the most granular native analytics for professional and video content respectively, including detailed audience demographics and content-level performance breakdowns. Instagram's native analytics have improved significantly and are well-suited for visual content. TikTok's analytics dashboard is strong for video retention and follower activity data. The gap between platforms has narrowed in recent years - the real limitation of native tools is that they are siloed, which is why cross-platform tools become valuable once you manage more than two or three channels.
Data-driven content optimization is not a one-time project - it is an ongoing habit that compounds over time. Each audit cycle adds to your understanding of your audience. Each test either confirms or corrects a previous assumption. Over 3, 6, or 12 months, this process produces a level of content clarity that no amount of creative brainstorming alone can match. Start with the metrics that matter most to your current goals, build a simple audit rhythm, and let the data tell you what your audience actually wants. If you want a faster path to those insights, exploring the AI-powered content tools at Brandlix can help you surface patterns and recommendations without spending hours in spreadsheets.