If you cannot explain to your boss what your social media budget actually delivers, it will get cut at the next meeting. That is exactly why it matters to know how to calculate social media ROI, instead of just counting likes and followers. In this guide, we show you concrete formulas, real example calculations, and the metrics that actually matter in 2026.
- Social media ROI is calculated as (profit from social media minus investment) divided by investment, times 100.
- Investment includes not just ad spend, but also work hours, tools, and content production.
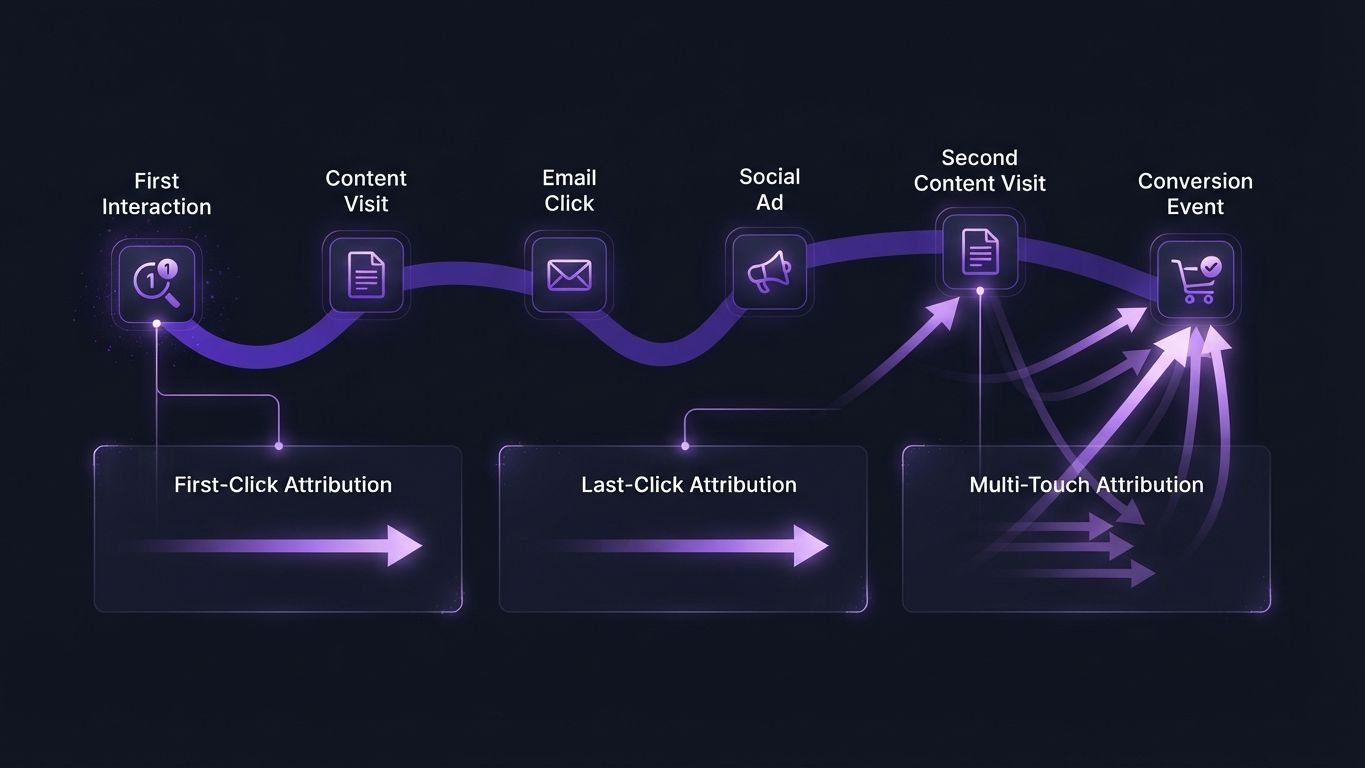
- Assisted conversions and multi-touch attribution give more realistic numbers than last-click models.
- Without UTM tracking and clear target KPIs, every ROI calculation stays a rough guess.
- Tools like Brandlix automate reporting and save you time on data preparation.
What does social media ROI actually mean?
Social media ROI (return on investment) measures how much financial value your social media activities generate relative to the resources you put in. It is expressed as a percentage and shows whether the time, money, and staff spent on your channels pay off. A positive ROI means the return exceeds the cost.
Many teams confuse ROI with engagement metrics like likes or reach. Those are important intermediate steps, but they are not ROI. Only once you weigh revenue, leads, or cost savings against actual spending do you get a solid number.
- Engagement rate shows interaction, but no monetary value.
- Reach shows visibility, but no conversion.
- ROI connects both to an actual business result.
How do you actually calculate social media ROI?
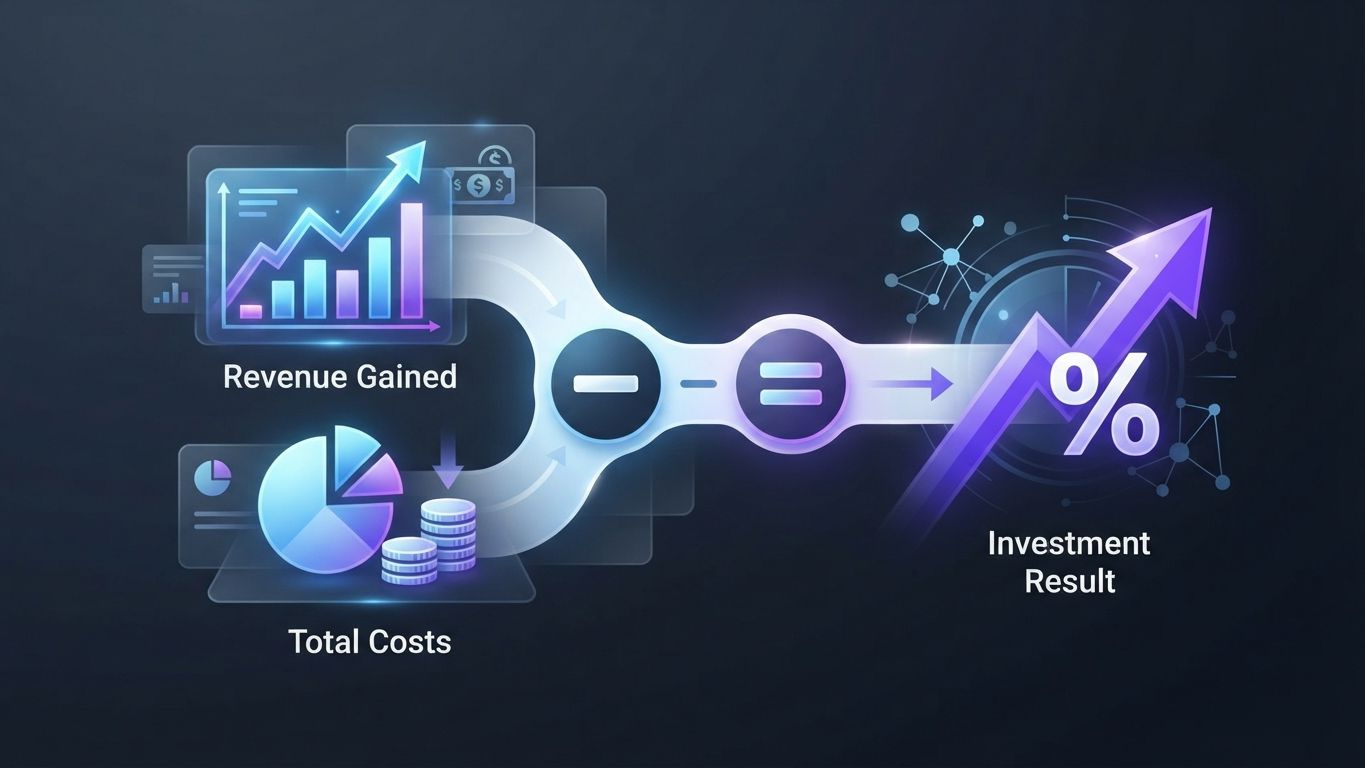
The basic formula is: ROI = (return from social media minus investment) divided by investment, times 100. The result shows you what percentage of profit (or loss) you generate per dollar invested. The more precisely you define return and investment, the more reliable the number becomes.
Step-by-step guide
- Define your goal: revenue, leads, traffic, or brand awareness.
- Set a monetary value for each goal metric, for example the average lead value or customer lifetime value.
- Capture all costs: ad spend, tool subscriptions, content production, agency, or staff costs.
- Track conversions with UTM parameters and analytics software over at least 30 to 90 days.
- Plug the return and investment into the formula and calculate the percentage.
- Compare the result across time periods and platforms to spot trends.
Example calculation
Let's say you spend 2,000 euros a month on ads, tools, and content, and you generate a provable 6,000 euros in revenue from it. Then the calculation is: (6,000 - 2,000) / 2,000 x 100 = 200 percent ROI. In other words, every euro you invest brings back 2 euros in additional profit.
Which KPIs should you track for the ROI calculation?
The most important KPIs are conversion rate, cost per lead, customer acquisition cost, click-through rate, and customer lifetime value. These metrics connect social media activity directly with revenue and show you which platform is actually delivering results.
- Conversion rate: The share of users who take a desired action after clicking.
- Cost per lead (CPL): Investment divided by the number of leads generated.
- Customer acquisition cost (CAC): Total costs divided by the number of new customers.
- Click-through rate (CTR): The ratio of clicks to impressions, shows content relevance.
- Customer lifetime value (CLV): The expected total revenue from a customer over the entire relationship.
Organic social traffic tends to have lower acquisition costs than pure paid campaigns, when content is published consistently over several months. That is exactly why it pays to evaluate organic and paid performance separately.
Which tools help with the social media ROI calculation?
The most reliable tools combine platform analytics, UTM tracking, and CRM data in a single dashboard. Manual spreadsheets work fine for small accounts, but they quickly become messy and error-prone once you manage three or more channels.
| Tool type | Strength | Limitation |
|---|---|---|
| Native platform analytics (Meta, LinkedIn, TikTok) | Free, straight from the source | No cross-platform view |
| Google Analytics with UTM tags | Shows traffic source and conversion path | Requires a clean link structure |
| CRM integration (e.g. HubSpot, Salesforce) | Connects leads to actual revenue | Higher setup effort at the start |
| All-in-one social media suites like Brandlix | Automated reporting across connected platforms, AI insights | Requires onboarding your accounts |
With Brandlix's Social Media Analytics, you can bring together the metrics of every connected channel in a single report, instead of manually exporting them from ten different dashboards. This not only saves time, it also significantly reduces transcription errors in the ROI calculation.
How does ROI differ across platforms?
ROI varies significantly depending on the platform, audience, and content format. LinkedIn often delivers higher B2B lead quality, while Instagram and TikTok score better on brand awareness and impulse buying behavior. Pinterest often shows surprisingly long conversion windows, because users there plan for the long term.
| Platform | Typical strength | Relevant ROI metric |
|---|---|---|
| B2B lead generation | Cost per lead, CAC | |
| Brand awareness, visual products | Engagement-to-conversion ratio | |
| TikTok | Reach with younger audiences | View-through conversion |
| Long-term purchase intent | Assisted conversions over 30 to 90 days | |
| Retargeting and community | ROAS (return on ad spend) |
If you post across multiple platforms, you should calculate ROI separately per channel instead of forming a single average. A Content Calendar helps you document publishing times and formats per platform, so you can later trace which post had which effect.

What mistakes most often distort the ROI calculation?
The most common mistakes are missing UTM tracking, ignoring labor costs, and relying purely on last-click attribution. These three mistakes almost always cause the calculated ROI to deviate significantly from reality, in either direction.
- Missing UTM tracking: Without unique links, you do not know which post brought which click.
- Ignored labor costs: Anyone counting only ad spend massively underestimates the real investment.
- Last-click attribution: Social media often acts as an assist, not the last touchpoint before a purchase.
- Measurement window too short: Many purchase decisions take 2 to 6 weeks after the first contact.
- Missing baseline: Without a comparison value from the previous period, growth cannot be put into context.
Multi-touch attribution takes more effort to set up, but it delivers far more realistic numbers than the simple last-click model. If you avoid these mistakes, your social media ROI calculation becomes an argument that actually holds up in your next budget conversation.
How do you lower the cost side of the ROI formula?
The most effective way to lower your investment is by automating planning, publishing, and reporting, not by producing less content. In social media, time is often the biggest hidden cost factor, even ahead of the ad budget.
- Automated scheduling reduces manual publishing time across multiple channels at once.
- AI-powered content creation shortens the time from idea to finished post.
- Central reporting dashboards eliminate weekly manual export work.
- Templates and content recycling lower production costs per post.
This is exactly where tools like Brandlix's AI Social Media Agent or Social Media Autopilot come in: they handle planning, creation, and publishing across all 10 platforms, so your team can focus on strategy instead of copy-paste work. Fewer work hours per post automatically mean a better ROI number, even if revenue stays the same.

How do you plan the right posting time to boost ROI?
The best time to post is whenever your specific audience is active, not a blanket value from some generic study. Timing directly affects reach and therefore indirectly affects every downstream ROI metric, like clicks and conversions.
- Analyze your past post insights by time of day and day of the week.
- Test identical content at different times over at least four weeks.
- Use a tool like the Best Time to Post Calculator to get starting values for your industry.
- Adjust the times every quarter, since user behavior changes.
It is also worth checking out the Hashtag Generator to increase reach per post at no extra cost. More organic reach at the same investment directly improves the ROI formula on the return side.
How do you read ROI over the long term instead of per campaign?
Long-term ROI results from the combination of customer lifetime value, brand awareness, and repeat purchases, not just from a single campaign. A post can look expensive in the short term but generate profitable repeat customers over months.
- Track cohorts of customers acquired through social media over at least 6 to 12 months.
- Compare the repeat purchase rate of social media customers with other acquisition channels.
- Factor in brand awareness as an indirect value, for example through share of voice.
Once you take this perspective, it becomes clear: a single month with negative ROI does not automatically mean a failed channel. Only the trend across several quarters shows whether investing in a channel truly pays off.
How does a platform like Brandlix specifically help with the ROI calculation?
Brandlix bundles planning and publishing for all 10 platforms plus analytics in a single dashboard, so you no longer need to manually merge revenue and cost data. This reduces reporting time and makes the ROI formula much quicker to apply.
- A central overview of performance across your connected social channels.
- Automated reports cut down manual spreadsheet work.
- AI suggestions for posting times and content formats increase engagement without extra budget.
Anyone who plans regularly instead of posting spontaneously usually also sees more stable ROI figures over time, because content is more consistently aligned with the audience.
Frequently Asked Questions
What counts as a good social media ROI number?
There is no universal target, since it depends heavily on your industry, business model, and investment level. As a rough guide: an ROI above 100 percent means the investment has more than doubled, while values below 0 percent indicate a loss.
How do you calculate ROI without direct sales through social media?
Assign an estimated monetary value to indirect goals like newsletter signups or website traffic, based on your company's historical conversion data. This lets you translate brand building into an ROI formula too, instead of only reporting "soft" metrics.
How often should you calculate social media ROI?
Monthly for an operational overview and quarterly for strategic decisions is a good rhythm for most teams. Shorter periods often produce distorted numbers, because purchase decisions frequently take several weeks.
Does time count as a cost factor in the ROI calculation?
Yes, work hours for planning, content creation, and community management absolutely belong on the investment side of the formula. Anyone counting only ad spend gets a misleadingly positive ROI number.
Calculating social media ROI sounds like spreadsheet work, but it is really a strategic decision-making tool that shows you where your budget actually has an impact. Start with a clear formula, track consistently over several weeks, and automate reporting wherever you can, so you have time left for the actual strategy.