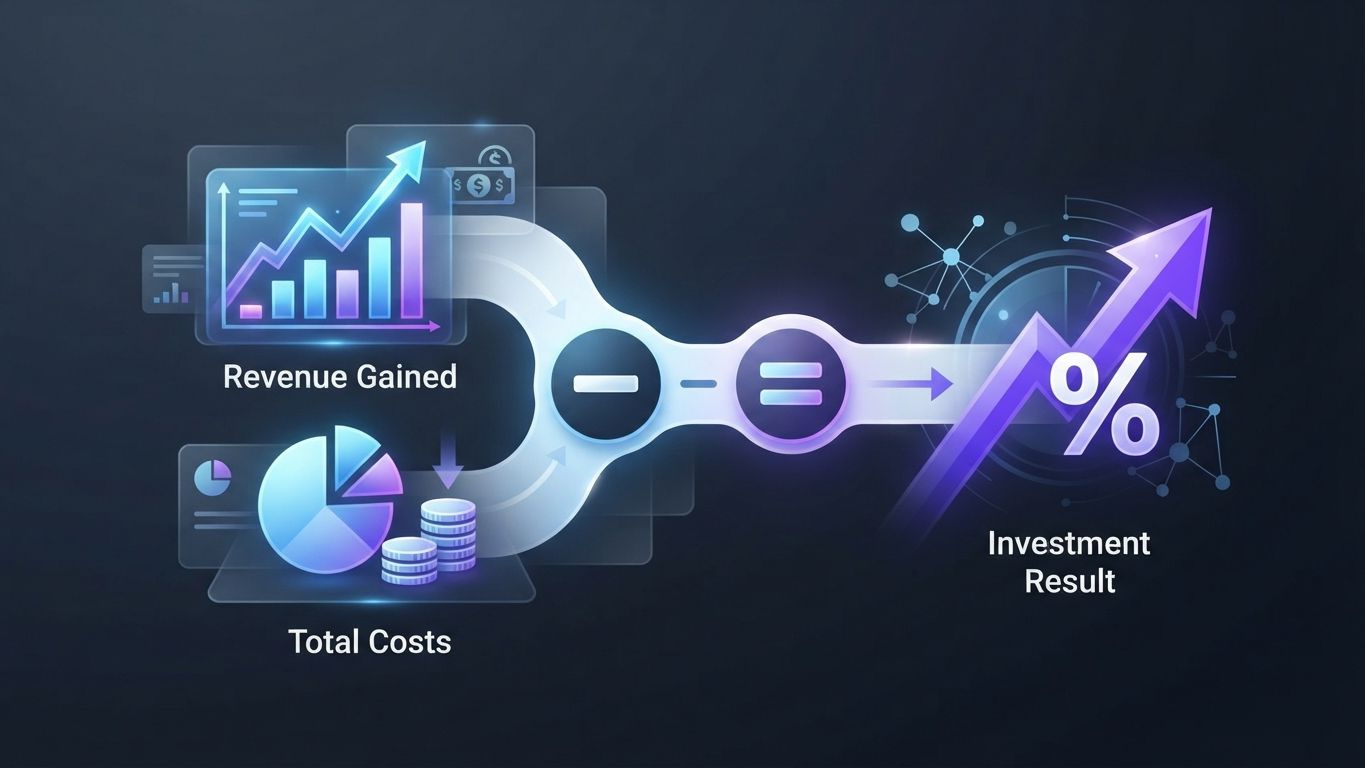
Social media reporting for clients often decides whether a contract gets renewed or not. Many agencies and freelancers deliver great work but fail to make that work visible. A clear report does not just show numbers, it tells a story about progress and value.
- Good client reporting answers the question "Was it worth it?" first, details come after.
- Reports should limit the key takeaways to 1-2 pages, everything else belongs in an appendix.
- According to internal industry estimates, automated reporting tools save agencies 3-6 hours per client per month.
- The best KPIs differ by goal: reach, engagement, conversions, or community growth.
- Visual reports with comparison periods actually get read by clients more often than plain number tables.
What belongs in good social media reporting for clients?
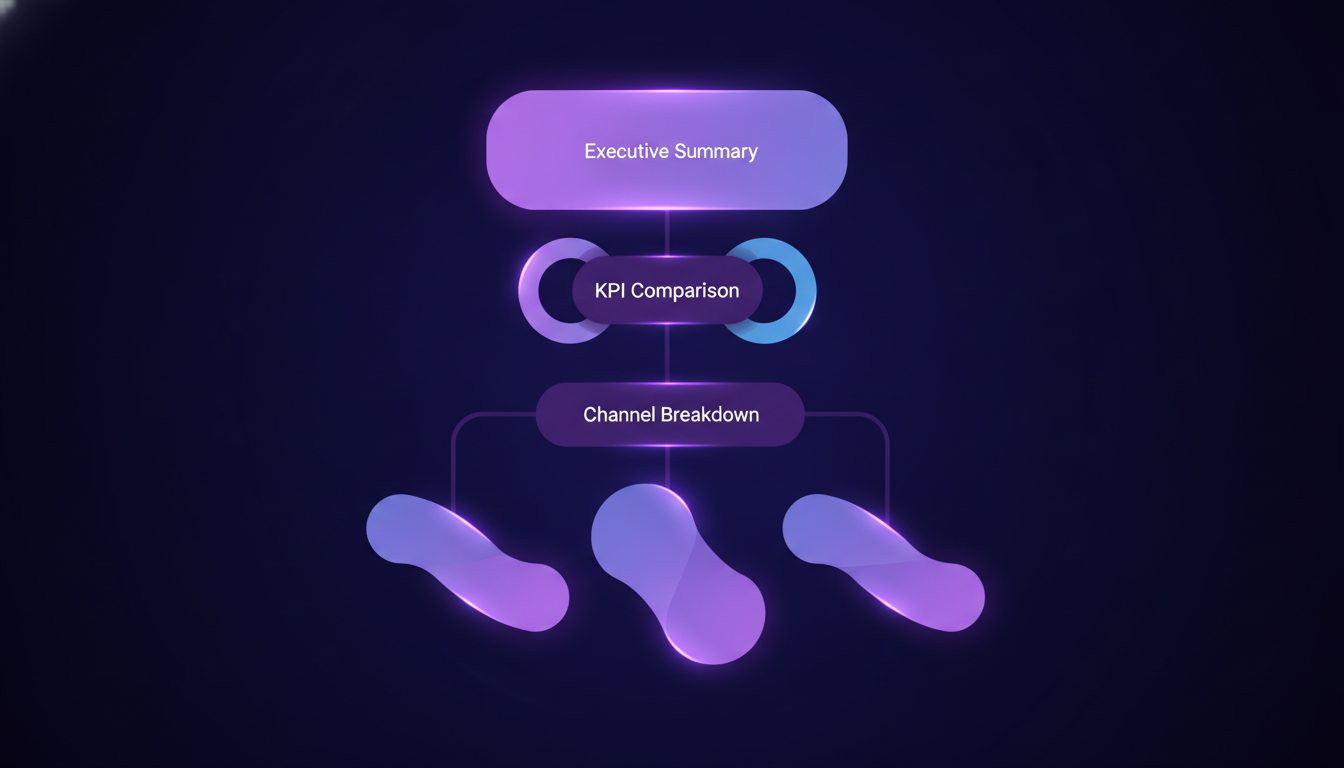
Good social media reporting for clients includes a brief summary, 3 to 5 core KPIs, a comparison with the previous period, and a clear recommendation for the next month. Everything else is optional and, if included at all, belongs in an appendix.
Clients rarely read more than half a page of text. They want to know whether the budget paid off, what happens next, and whether they need to step in. A report that does not answer these three questions in the first 30 seconds often just gets skimmed.
- Executive summary with 3 to 4 sentences on overall performance
- Core KPIs with the percentage change from the previous month
- Top-performing posts with a short explanation of why they worked
- Concrete next steps or ideas to test
The order also matters. Start with the result, not the method. A client wants to hear "Reach grew 34 percent" first, not "We published 12 posts on Instagram this month."
How often should you report social media results to clients?
Most agencies report monthly, supplemented by a short weekly update in writing or chat. This combination keeps clients informed without requiring an elaborate document every week.
A monthly report is suited to strategic decisions and budget conversations. A weekly update, on the other hand, is more of a short status check: what went well, what was adjusted, and whether there are any urgent issues.
- Weekly: a 3-5 sentence status update by email or Slack
- Monthly: a full report with charts and a comparison period
- Quarterly: a strategic review with goal adjustments
- Yearly: an overall summary and planning for the coming year
For ongoing campaigns with an ad budget, a real-time dashboard the client can access anytime is also worth setting up. It significantly reduces email follow-up questions, because many clients can simply check for themselves whenever they are curious.
Which KPIs should appear in a social media report for clients?
The right KPIs depend on the campaign's goal, not on whatever is easiest to measure. A report for brand awareness looks different from one for lead generation or community building.
A common mistake is showing too many metrics at once. That dilutes the actual message and leaves the client alone in a jumble of numbers.
| Campaign Goal | Primary KPIs | Secondary KPIs |
|---|---|---|
| Brand awareness | Reach, impressions, follower growth | Share of voice, mentions |
| Engagement / Community | Engagement rate, comments, shares | Response time, community growth |
| Traffic / Leads | Click-through rate, website visits, conversion rate | Cost per click, cost per lead |
| Sales / E-Commerce | ROAS, revenue from social, conversion rate | Average order value, repeat purchase rate |
According to several industry-wide analyses from social media platform operators, the average engagement rate on Instagram for business profiles usually falls between 0.5 and 3 percent, depending on industry and follower size. Numbers below or above that should always be put in context relative to the relevant industry in your report, otherwise they look arbitrary.
Avoiding Vanity Metrics
Follower counts alone say little about business success. A client with 50,000 followers and a 0.3 percent engagement rate is worse off than one with 8,000 followers and a 6 percent engagement rate.
- Always show ratios, not just absolute numbers
- Briefly explain why a metric is relevant to the business goal
- Skip any metric you could not explain yourself if the client asked about it
How do you build a social media report that truly convinces clients?
A convincing report combines numbers with context and a clear recommendation. Clients want to know not just what happened, but what it means for their business and what to do next.
Format plays a bigger role in this than many people think. A PDF full of plain tables feels technical, while a visual dashboard with colors and trend lines feels tangible.
- Start with a one-sentence summary of overall performance
- Show 3 to 4 core charts compared to the previous month
- Highlight the 2 to 3 best-performing posts and explain why they worked
- Name one thing that did not work and what you are changing as a result
- Close with concrete next steps for the coming month
Being transparent about setbacks builds more trust than a report that only shows wins. Clients almost always notice when a report is being spun, and that undermines the relationship faster than an honest decline with a clear explanation.
Tools like Brandlix's social media analytics help build this structure automatically, instead of manually pulling numbers from ten different platforms every month.
How do you automate social media reporting for multiple clients?
Automation saves the most time once you manage more than three or four clients at once. Manual reporting through Excel and screenshots does not scale and quickly leads to errors, especially across ten platforms with different analytics dashboards.
According to internal estimates from many social media teams, an agency that manually gathers data from Instagram, LinkedIn, TikTok, and Facebook for each client loses between three and six hours per client per month on reporting alone. With ten clients, that quickly adds up to 30 to 60 hours a month missing from strategic work.
- A central data source for every platform instead of separate logins
- Automatically generated comparison periods and trend arrows
- White-label reports with the client's branding instead of the agency's
- Recurring schedules that send reports out automatically
This is exactly where a platform like the AI social media agent comes in: it pulls together performance data from all ten channels, from Instagram to Bluesky, and turns it into finished summaries you can share directly with clients. If you also plan posts through the content calendar, you can combine reporting and scheduling in one workflow instead of switching between multiple tools.
Checklist for Choosing a Tool
- Does the tool support every platform you manage for clients?
- Can the reporting layout be adapted to the client's branding?
- Can the report be sent automatically on a fixed schedule?
- Is there a raw data export for clients who want to dig deeper?
How do you present bad numbers to a client without losing their trust?
The best way to present bad numbers is with a clear root-cause analysis and a concrete improvement plan, rather than hiding or downplaying them. Clients almost always accept a decline as long as they can see you are still in control.
A drop in engagement can have many causes: an algorithm update, seasonal effects, changing user behavior, or genuinely weaker content. What matters is naming the most likely cause instead of staying vague.
- Show the decline in the context of a longer time series, not in isolation
- Compare it with industry-wide trends where available
- Say specifically what you will test next month
- Avoid excuses that sound like justification rather than analysis
An example sentence that works well: "Organic reach dropped 12 percent in May, which coincides with a platform-wide decline in short-video performance for this industry. In June, we are increasing the share of Reels and testing two new hook formats in the first week." That is honest, specific, and immediately shows a plan.
What mistakes should you avoid in client reporting?
The biggest mistake is providing too much data with no interpretation. A report with 15 tables and no clear takeaway leaves clients confused and unhappy, even when the results were actually good.
- Overly technical language with no explanation of what a metric means
- No comparison period, which makes numbers look isolated and meaningless
- No clear recommendation at the end of the report
- Irregular delivery, which makes clients feel forgotten
- Focusing purely on vanity metrics instead of business relevance
Another common mistake: the reporting format never gets adapted to the individual client. An e-commerce client cares about revenue and ROAS, while a B2B client cares more about lead quality and LinkedIn reach. A one-size-fits-all report for every client quickly feels generic.
For platform-specific metrics, it is also worth looking at specialized tools. The best-time-to-post calculator helps you build data-driven timing recommendations into the report, while the hashtag generator provides additional reach ideas for the coming month.
How often do clients actually check their social media reports?
Most clients read a report within the first 48 hours of receiving it, or barely read it at all after that. After that window, it mostly serves as a reference for later budget conversations or internal presentations.
That means the first few paragraphs and the first chart decide whether the report is perceived as valuable. Put disproportionate care into the executive summary and less into the detail tables further down.
- Send reports at a fixed, predictable time, for example on the first or second business day of the month
- Keep the core message visible on a single screen with no scrolling
- Use email subject lines that already hint at the result, such as "June Report: +22% Reach"
Anyone managing Instagram, LinkedIn, or TikTok separately benefits from specialized scheduling tools like the Instagram scheduler, the LinkedIn scheduler, or the TikTok scheduler, since performance data can flow straight from scheduling into the report without a manual export.

Conclusion: Reporting as a Trust-Building Tool, Not a Chore
Social media reporting for clients is more than an administrative task at the end of the month. It is the moment where you prove your work makes a measurable difference. A clear, honest, well-structured report reduces follow-up questions, strengthens the client relationship, and makes contract renewals more likely.
Combining reporting with a solid understanding of engagement rate and clear KPI definitions saves you from lengthy explanation conversations with clients. With platforms like the social media autopilot, you can map the entire process from planning to reporting in a single system, instead of manually clicking together data from ten tools. Anyone still building reports by hand today is losing valuable time that would be better invested in strategy and content.
Frequently Asked Questions
How long should a social media report for clients be?
The core takeaways should fit on 1-2 pages. Detailed raw data and extra charts belong in a separate appendix that only interested clients need to open.
Which tool works best for automated client reporting?
Tools that analyze multiple platforms at once and produce white-label reports save the most time. Make sure the tool covers all ten relevant channels you manage for clients, not just two or three.
Should you give clients access to live dashboards or just send monthly PDFs?
A combination works best: a monthly PDF report for strategic discussion and a live dashboard for clients who want to check in on their own in between. That noticeably reduces unplanned follow-up questions.
How do you handle clients who focus only on follower numbers?
Explain early in the client relationship why engagement rate and conversion metrics are more meaningful than raw follower counts. Show it using a concrete example from their own account so the difference becomes tangible.